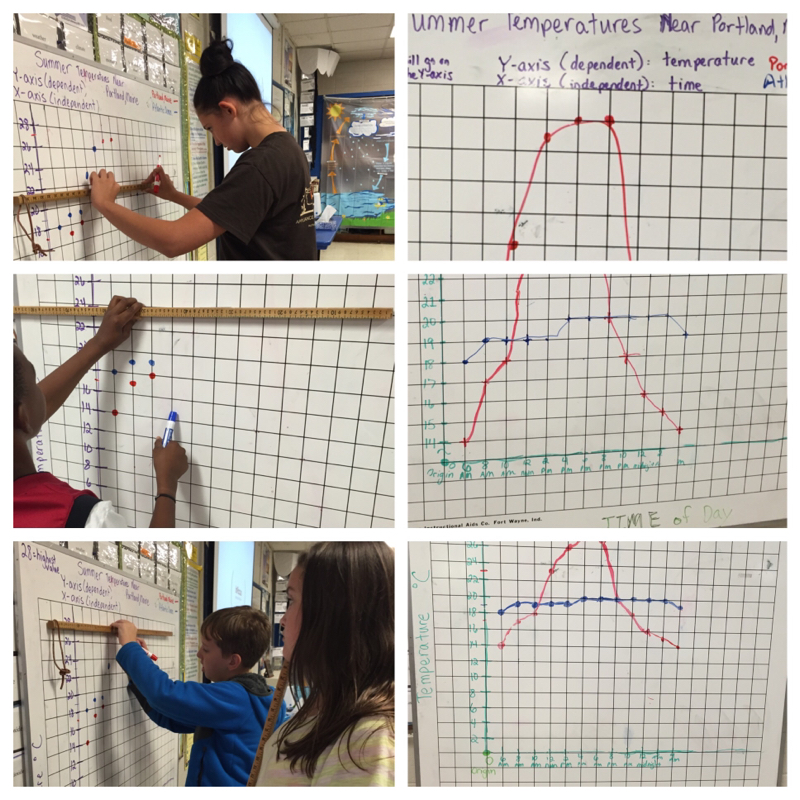
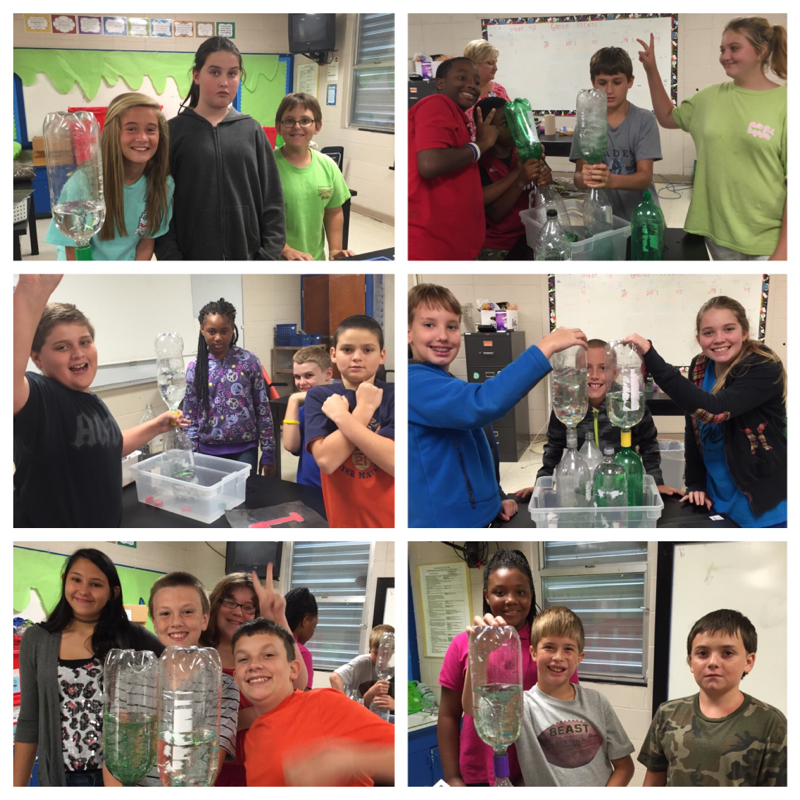
 Can you see the difference in the graphs starting with zero and the one starting with a break and the lowest value? Don't forget "Mr. Squiggly!" 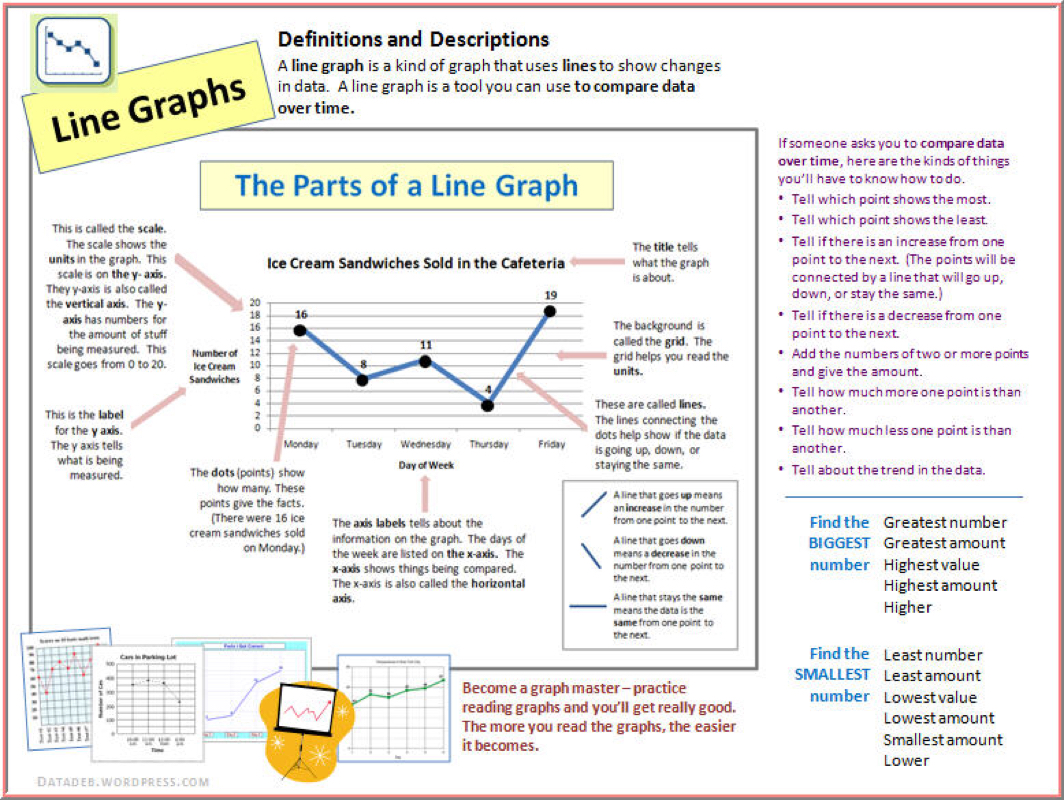 A line graph is what we used to show the differences in the temperature of soil and water over time. The video above will help you understand more about line graphs.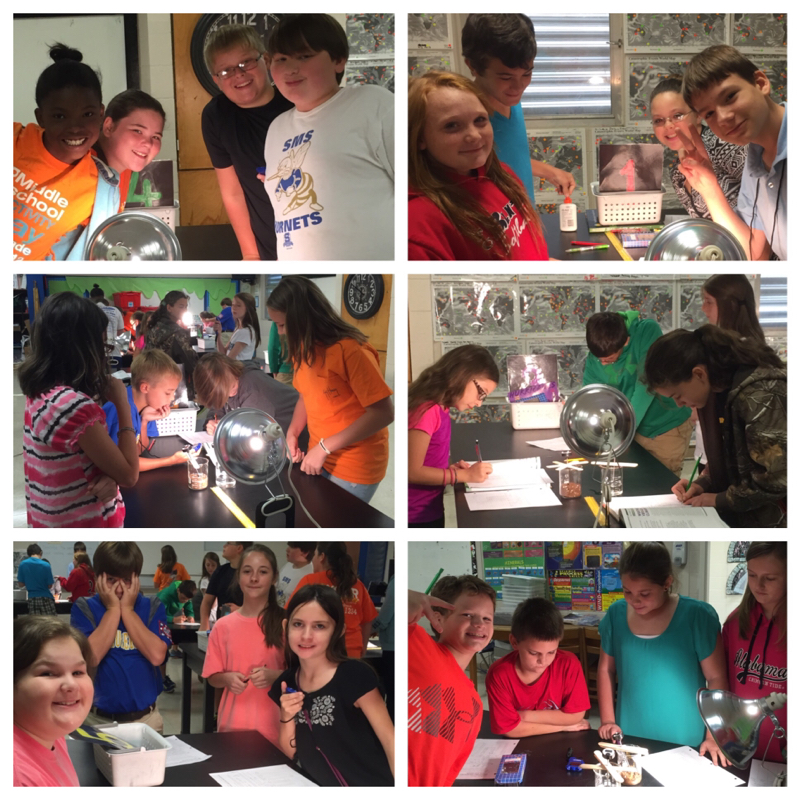 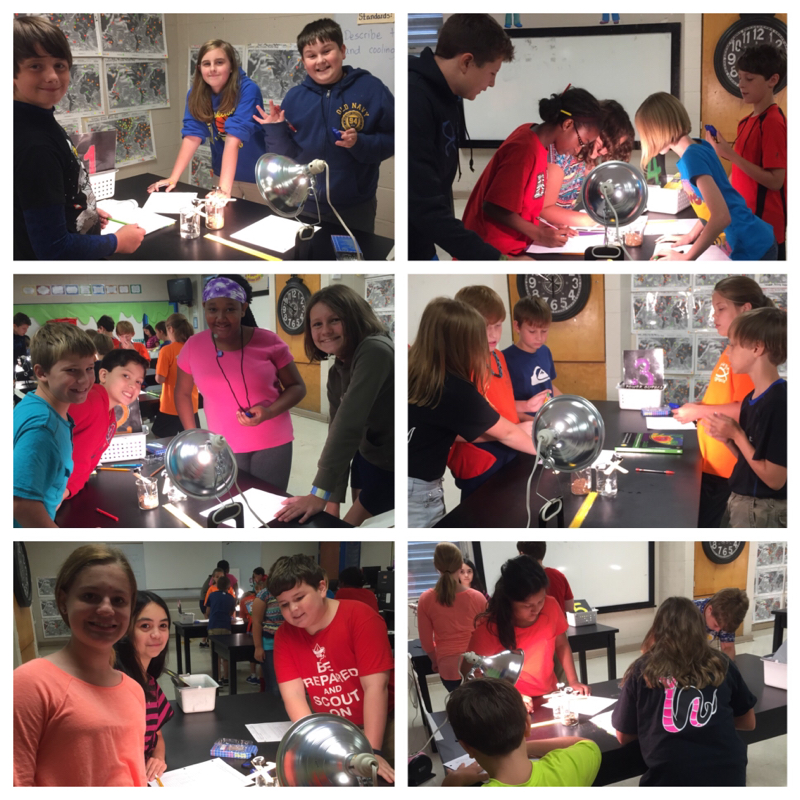 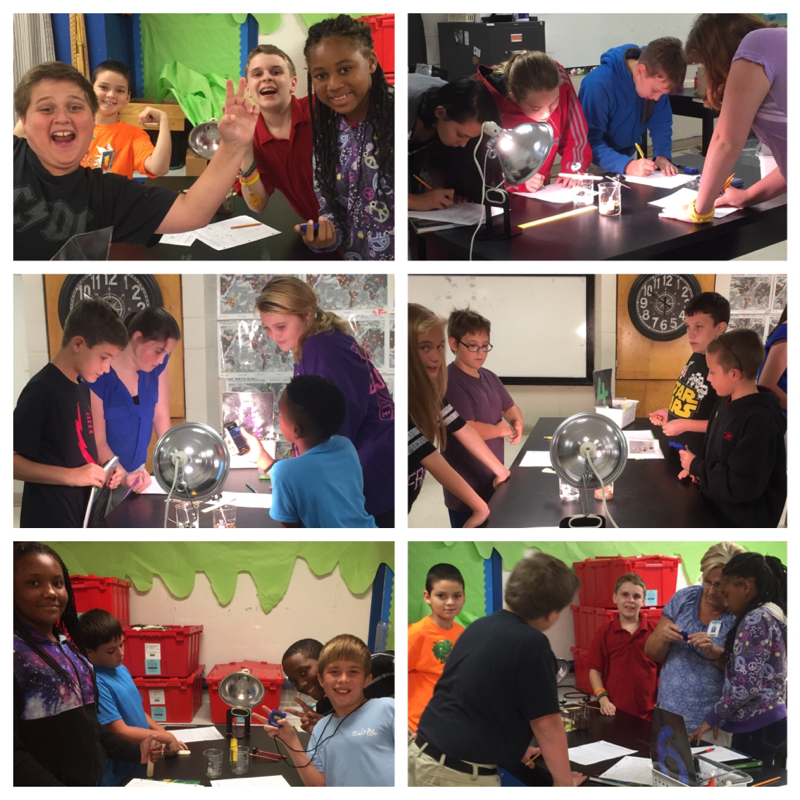 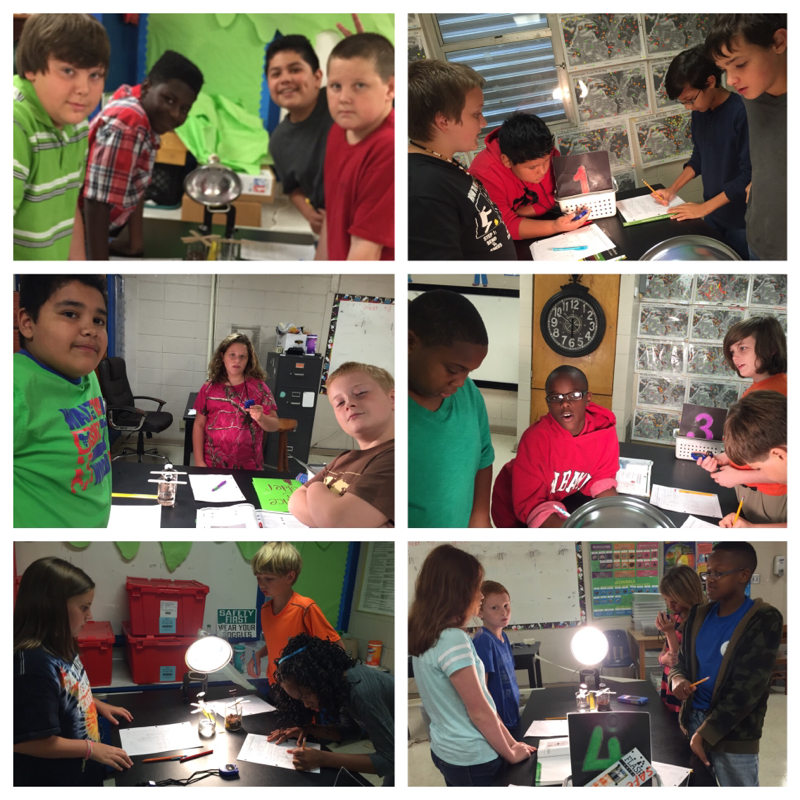 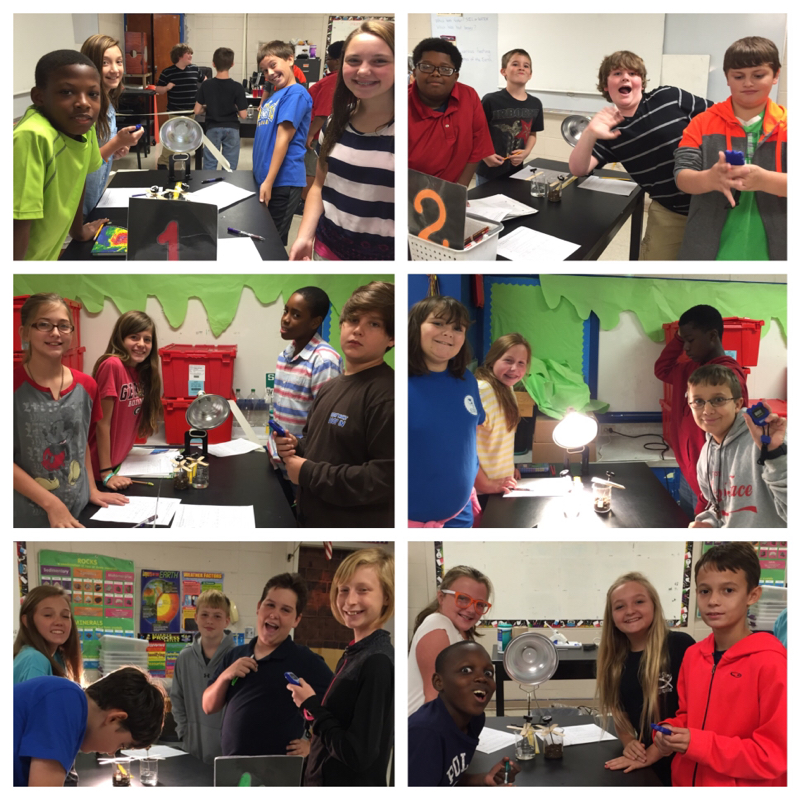 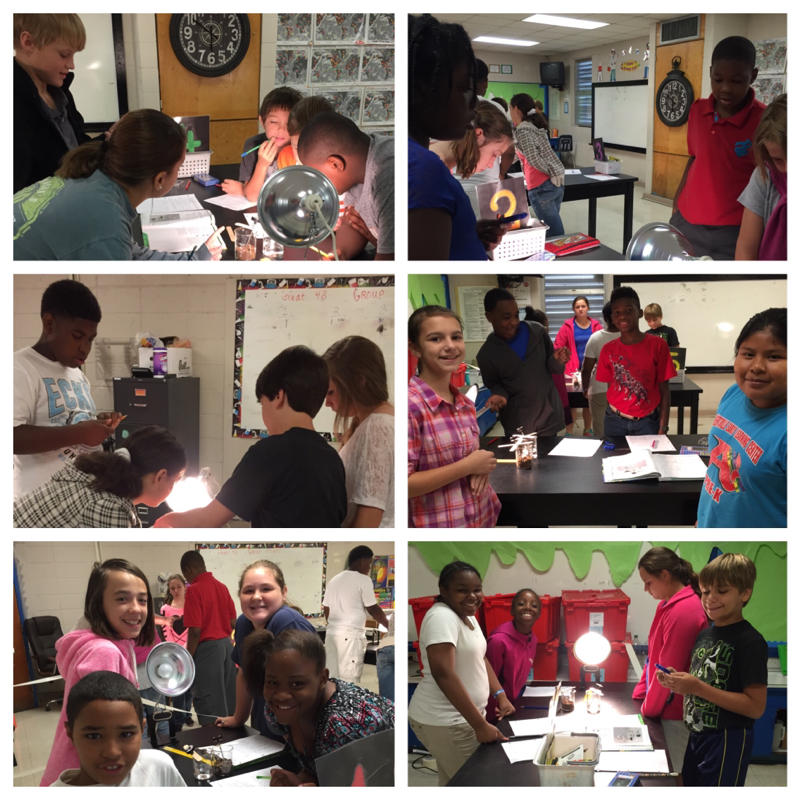 We graphed and analyzed lab results to determine if our hypotheses were correct. We learned that soil (representing Earth's land) heats faster than water (representing Earth's oceans). We also learned water holds heat longer than soil. Do you know why? Comment below if you do! 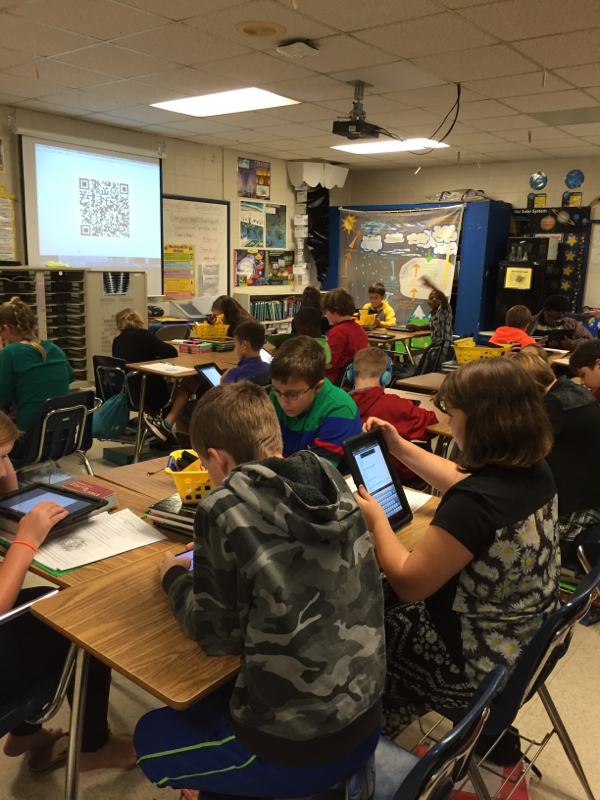 Students are taking their STORMS vocabulary quiz. Online quizzes are way cool. 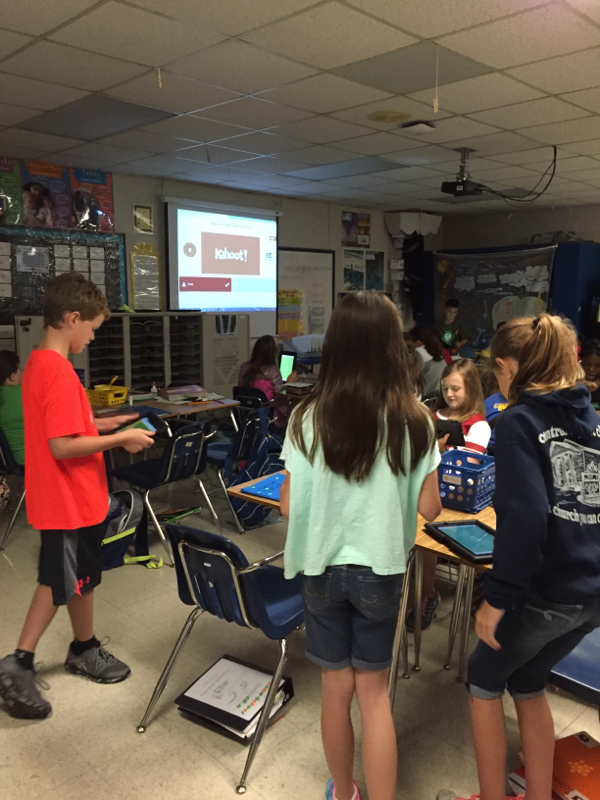 Kids couldn't sit down for this game. It's too exciting! Kahoot it!  House lunch!  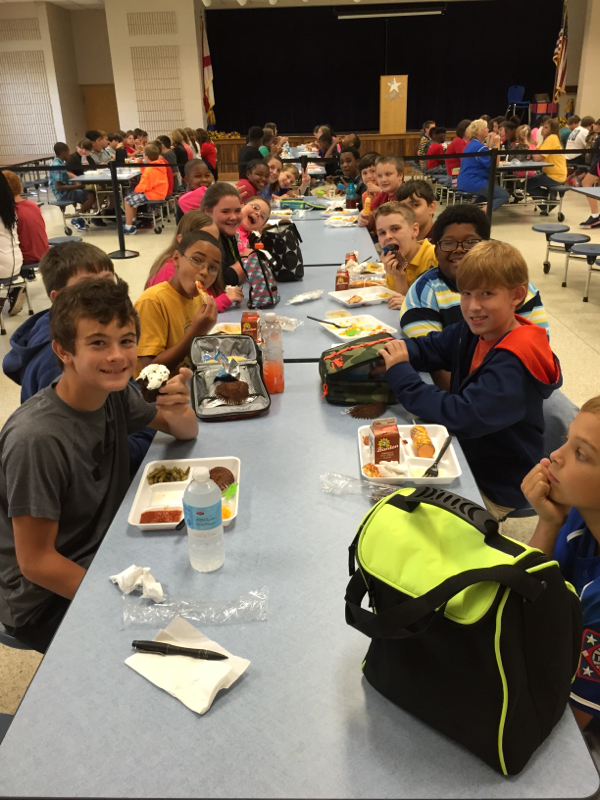 Fibonacci...BEST HOUSE! 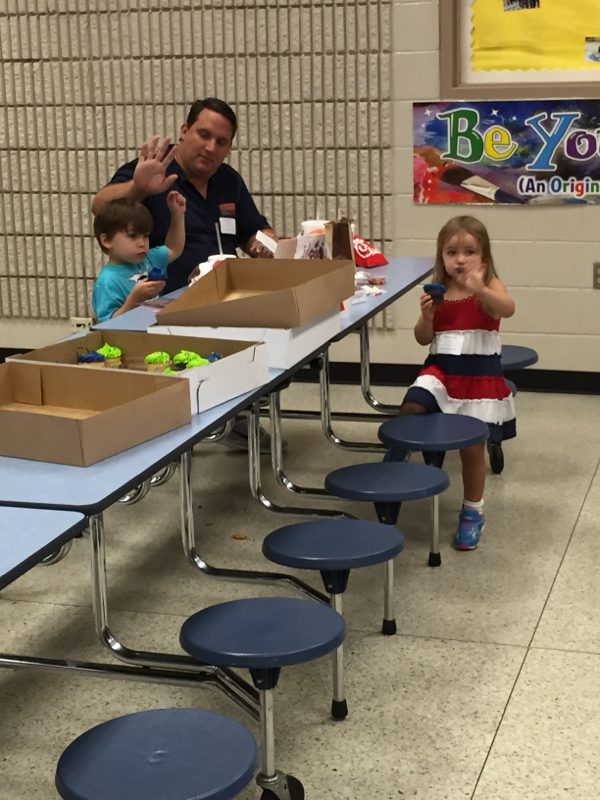 The hubs brought me cupcakes for my birthday and two little ones to brighten my day. House Reveal last Friday was amazing. Teachers and students are pumped to be the charter members of Sanford's New Houses. We can't wait to spend time with our new house families. 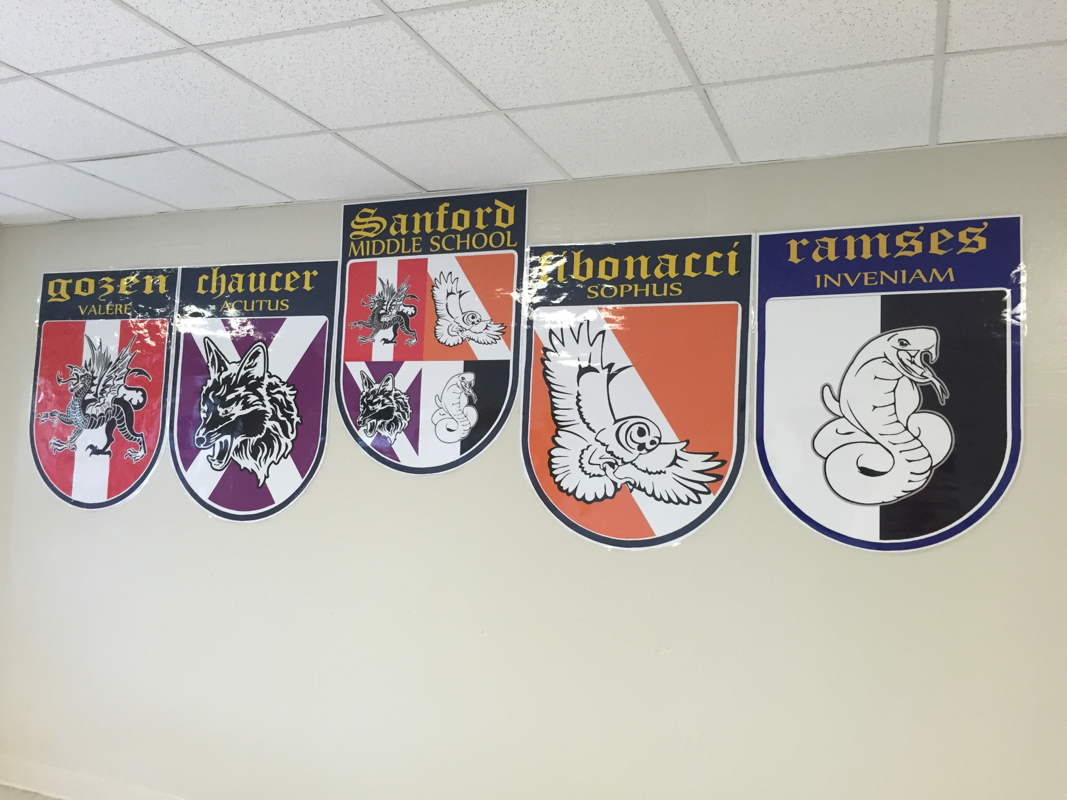 House Crests 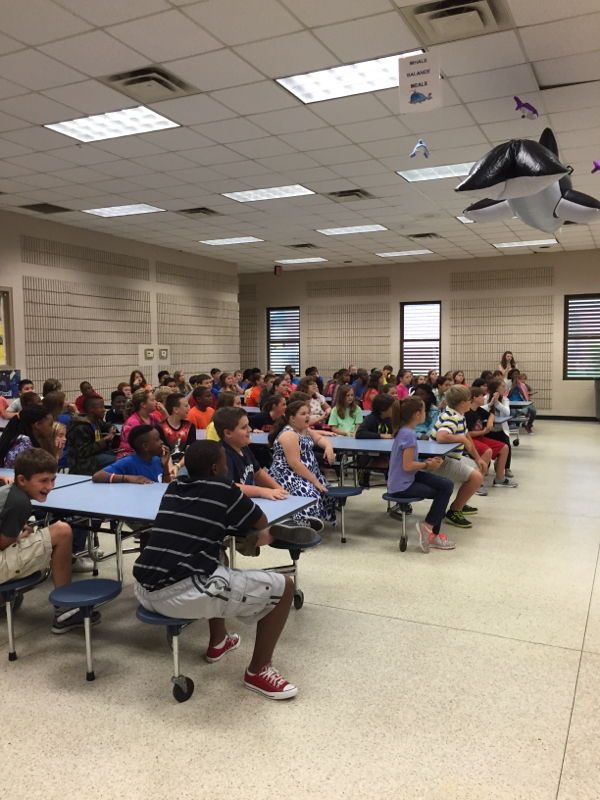 Students waiting to find out their houses. 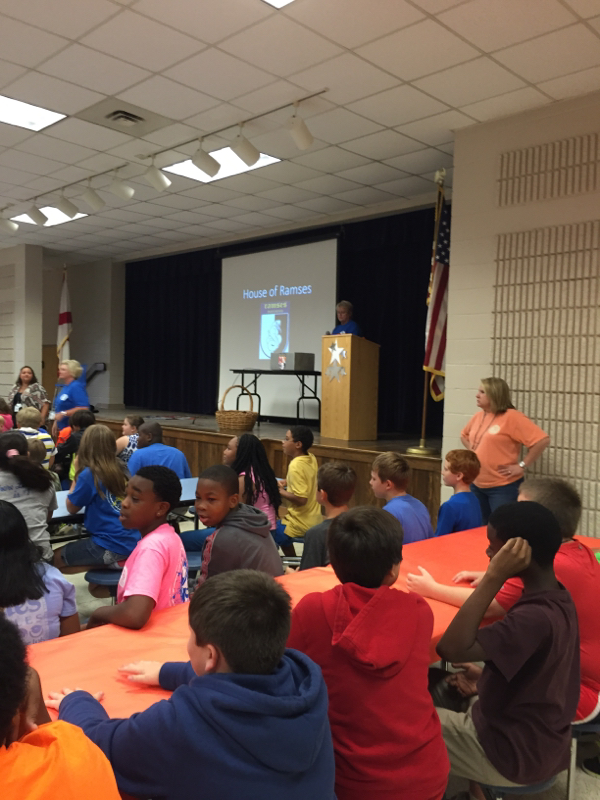 Ms. Reed announces the charter members of each house. 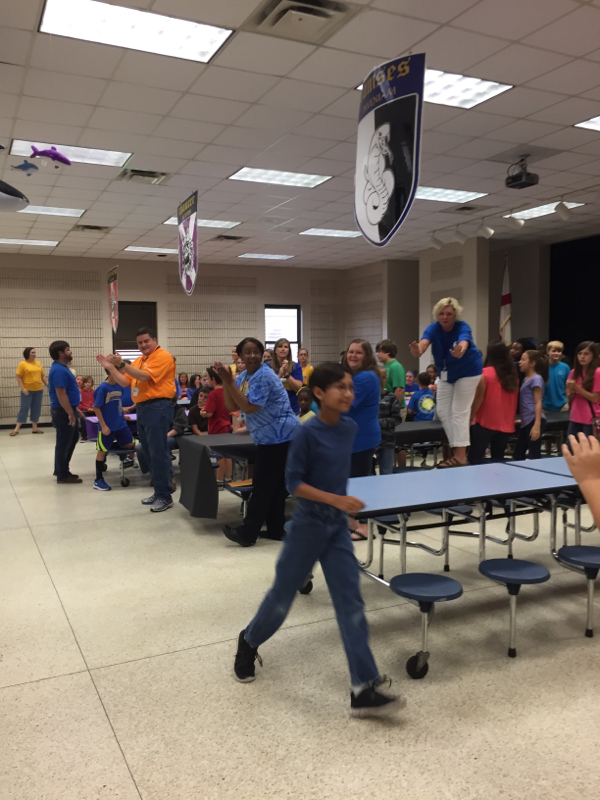 Excitement 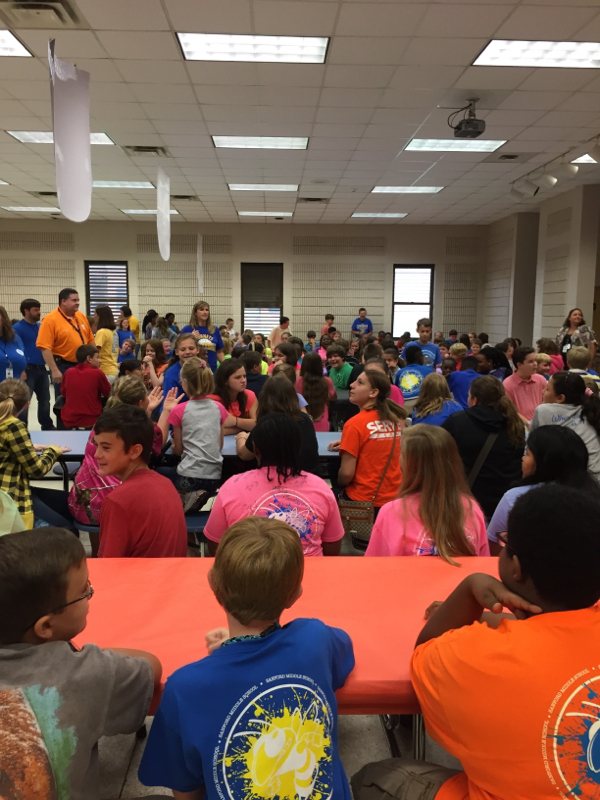 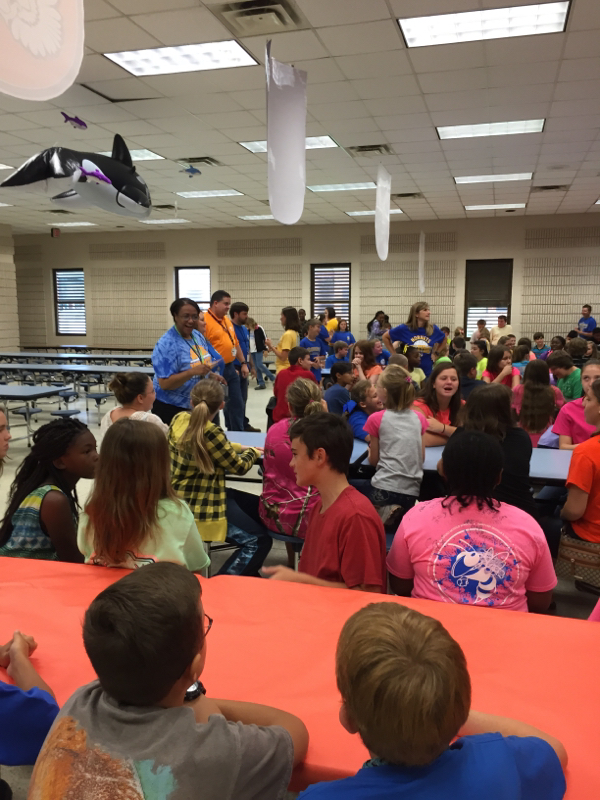 So happy together! 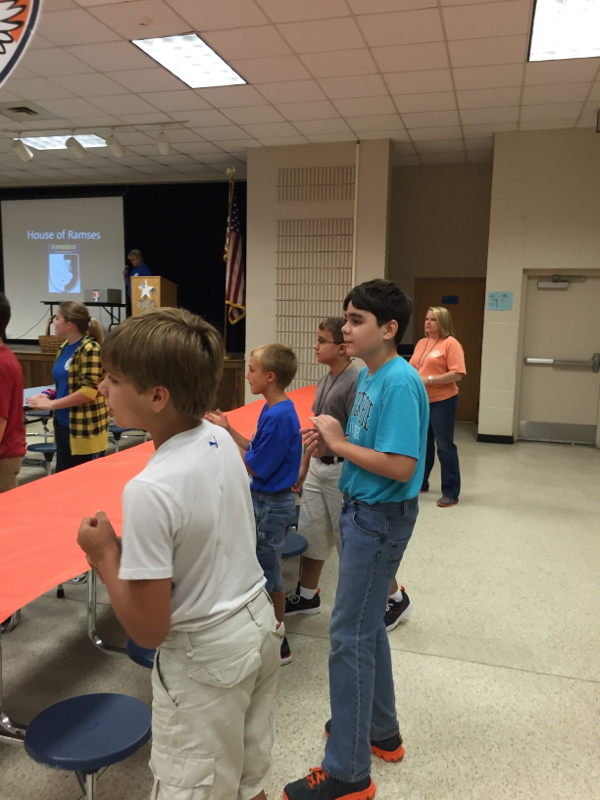 I love my Fibonacci peeps! |
Archives
May 2017
Categories |
 RSS Feed
